
Why Does Home Assistant Generate Different Loads During Reads and Writes?


Home Assistant produces different read and write loads because queries reuse cached pages, while state persistence modifies journals, indexes, and durable storage.
Opening a history chart can scan many stored rows without changing them, whereas one noisy sensor may create small transactions throughout the day. The first pattern favors sequential reads, database cache, and query indexes; the second adds synchronization, journal updates, filesystem metadata, and flash write amplification. Their graphs therefore differ even when both operations involve the same Recorder database.
Live State Changes Create More Than One Write
Recorder converts selected state and event changes into database transactions. A logical row insertion can also update indexes and a journal or write-ahead log before the filesystem and device cache acknowledge durable completion.
A database and statistics explainer separates short-term state storage from long-term statistics, clarifying why Recorder data structures can touch several related structures rather than one append-only file.
High-frequency entities create many small logical changes that may be committed in groups. This can appear as periodic bursts; the physical bytes written may exceed the payload because database and storage layers preserve consistency.
History Reads Depend on Range, Selectivity, and Cache
A current-state lookup is small, but a multi-entity history chart can scan a large time range, decode attributes, aggregate results, and send them to the client. Useful indexes and warm database pages can keep many of those operations away from physical storage.
A long-running performance case found history access extremely slow despite ordinary live use, showing that history-query workload may reveal a query-path problem that current-state control does not exercise.
Repeated reads often become faster when relevant pages remain in memory. That advantage disappears after restart, memory pressure, or a different date range, so one warm query is not a reliable measure of storage capacity.
Write Cost Grows With Logging and Neighboring Services
Home Assistant Core is not the only writer on a typical home server. Debug logs, add-on databases, backups, camera snapshots, and container logs may share the same device and cause queueing precisely when Recorder is trying to commit.
Practitioners reducing flash wear observed that logs and related components add write cycles, which is why whole-volume write activity should include the whole volume rather than only the main database process.
Process-level attribution separates application behavior from shared-storage contention. If Recorder is quiet while another container owns the writes, changing entity exclusions will not address the observed load.

Maintenance Can Reverse the Usual Pattern
Purging expired rows, rebuilding indexes, vacuuming, or repacking can read and rewrite large parts of a database. During that window, a task described as cleanup may create both heavier reads and heavier writes than normal state ingestion.
Recorder configuration discussions connect retention and purge behavior to database maintenance, so retention and purge behavior is essential when a regular load spike appears at the same time each day.
The read-versus-write explanation stops when the bottleneck is CPU-side template evaluation, client rendering, or network delivery. Storage counters must rise with the symptom; otherwise the database is merely adjacent to the delay.
Compare One Read and One Write Path
Choose a fixed history query and a harmless state-changing action. For each, record request latency, CPU, database time, disk throughput, IOPS, queue depth, and device latency from a cold start and then a repeated warm run.
The related retained-data growth explains why metadata and history growth change the workload, anchoring the comparison in retained data rather than arbitrary benchmark traffic.
Classify the limit by covariance: slow first read plus fast repeat suggests cache locality; rising query time with range suggests scan cost; write delay plus queue depth suggests durable-storage contention; neither pattern suggests another layer. Optimize only the path that reproduces the user-visible delay twice.

Recommended products

Tech & AI HUB
More to Read
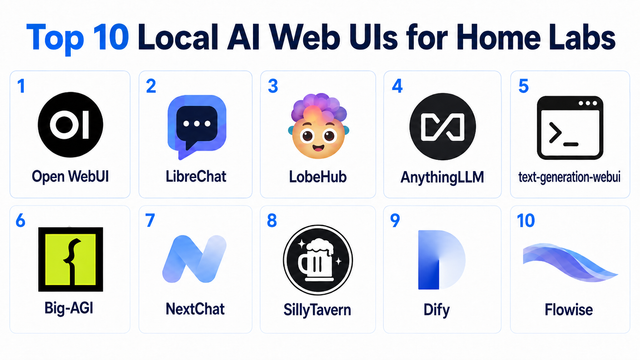
Top 10 Local AI Web UI for Home Labs In 2026
Compare 10 self-hosted local AI web UIs for home labs, covering Ollama support, RAG, agents, multi-user access, setup effort, and ideal use cases.
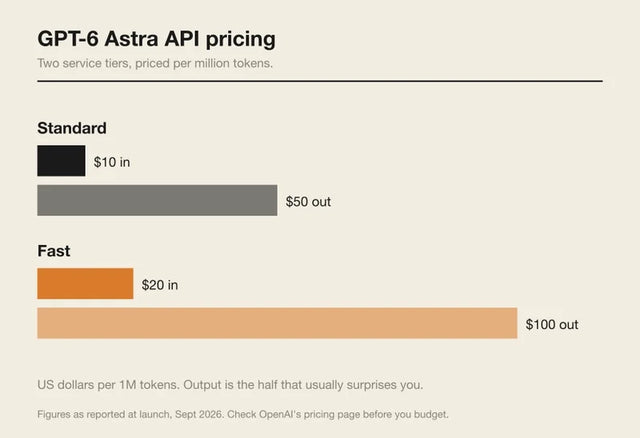
How Much Does GPT-6 Astra Cost Over Time? When Cloud AI Makes Sense vs Local AI
A practical GPT-6 Astra cost guide covering token usage, long-term AI workloads, cloud vs local tradeoffs, and why hybrid AI infrastructure matters.
GPT-6 Astra vs Local AI: Which Parts of an Agent Should Stay on Your Home Server?
GPT-6 Astra can stay in the cloud while your home server keeps files, memory, RAG, tools, permissions, and durable agent state local.


