
What Causes Home Assistant Startup Time to Increase With Library Size?


Home Assistant startup takes longer as its library grows when more database pages, indexes, registries, integrations, or generated state must be opened and validated.
A larger Recorder file does not mean every byte is read into memory at boot, and an extra media file may have no startup cost at all. Delay appears when growth expands a startup-critical path: database recovery, schema checks, statistics setup, registry parsing, integration discovery, or dashboard resource loading. The useful question is therefore which growing collection participates before the system becomes ready.
Startup Is a Sequence of Gates, Not One Timer
Process launch, configuration validation, database opening, core setup, integration initialization, platform discovery, and frontend readiness occur at different points. One slow gate can hold the ready state while other components have already completed.
A practitioner used integration startup sensors to identify slow components, demonstrating that integration startup timing should be decomposed by integration rather than treated as a single opaque duration.
Measure both total boot and named phase completion. If only the browser stays blank while automations and service calls already work, the library has not necessarily slowed Core startup; client assets or dashboard data may be the remaining gate.
Database Growth Raises Open, Recovery, and Migration Cost
Recorder may check its schema, recover a journal, establish indexes, initialize statistics, and serve early queries. Larger tables and a long unclean-shutdown journal can make these operations more expensive, especially on latency-sensitive storage.
A slow-start investigation reports lengthy integration setup and database-related symptoms, showing how database-related startup delay can be entangled with startup rather than visible as a separate history problem.
Database size alone remains an imperfect predictor because indexed access need not scan every row. A compact but damaged database can start worse than a large healthy one, while a large database on fast storage may open promptly.
Integration Inventory Adds Independent Setup Work
Each configured integration may load code, credentials, devices, entities, translations, and coordinator data. Local integrations can finish quickly, while cloud APIs, unavailable devices, DNS failures, or rate limits may wait for timeouts and retries.
A Core issue records startup delay tied to slow integration behavior, supporting the distinction between integration setup latency and raw Recorder size.
Adding inactive media or old history may not affect this path, but adding integrations and entities can. If disabling one unavailable integration collapses boot time while database size is unchanged, the inventory dependency is the stronger explanation.

Large Libraries Expose Storage and Corruption Boundaries
Growth increases the time required for backups, integrity checks, migrations, and maintenance, leaving more opportunity for full volumes or interrupted writes. Nearly full or unreliable storage can transform ordinary scaling into repeated recovery work.
Operators running very large databases describe the need to evaluate backend and maintenance behavior, which frames large database operation as a workload with operational limits rather than a harmless file-size number.
The library-size explanation fails when boot time stays high after testing with a clean database copy and the same configuration. At that point, integrations, network timeouts, custom components, or host contention deserve priority.
Run a Size-Controlled Startup Experiment
Create a verified backup, then record database size, entity count, integration count, free space, storage latency, and phase timestamps across three normal restarts. Test a copied instance with one suspected collection reduced, never the production source.
The cold-versus-warm capacity test explains how to distinguish cache warmth from real capacity, so repeated boots do not accidentally turn a cold-versus-warm difference into a library-size conclusion.
Attribute the delay only when reducing one collection repeatedly shortens the same startup phase. If the database matters, tune retention or backend; if an integration matters, isolate its setup; if neither moves the timer, inspect storage and network waits before buying hardware.

Recommended products

Tech & AI HUB
More to Read
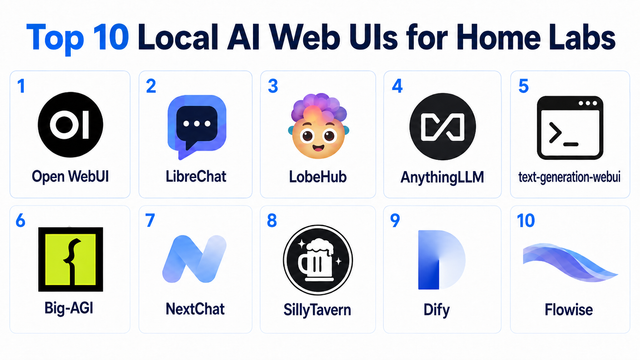
Top 10 Local AI Web UI for Home Labs In 2026
Compare 10 self-hosted local AI web UIs for home labs, covering Ollama support, RAG, agents, multi-user access, setup effort, and ideal use cases.
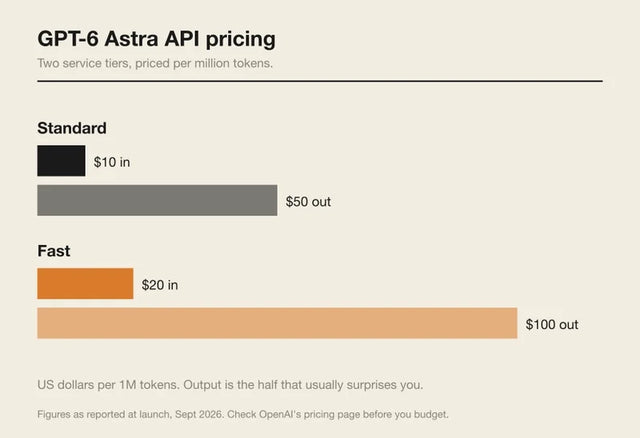
How Much Does GPT-6 Astra Cost Over Time? When Cloud AI Makes Sense vs Local AI
A practical GPT-6 Astra cost guide covering token usage, long-term AI workloads, cloud vs local tradeoffs, and why hybrid AI infrastructure matters.
GPT-6 Astra vs Local AI: Which Parts of an Agent Should Stay on Your Home Server?
GPT-6 Astra can stay in the cloud while your home server keeps files, memory, RAG, tools, permissions, and durable agent state local.


