
Why Do Latency Averages Look Healthy While Interactive AI Feels Slow?


Latency averages can look healthy while interactive AI feels slow because rare long waits and serial pauses dominate the turns users remember.
Nine local prompts might start in 300 milliseconds while the tenth waits five seconds for model loading or a tool. The mean remains below one second, yet the conversation repeatedly feels broken. Interaction quality follows the distribution and sequence of delays, not one central value across unrelated request types for the particular interaction the person remembers.
The Mean Hides the Shape of the Delay Distribution
An arithmetic mean combines all requests into one number. A few very slow turns can be diluted by many cache hits or short prompts. Percentiles reveal how often users cross a delay threshold, although even p95 can hide the worst one percent.
The latency tail explains that a small fraction of slow components can dominate whole-request latency in fan-out systems. Interactive AI similarly waits for its slowest required stage.
Workload mix matters too. Health checks and cached status calls should not share a latency average with voice turns, RAG retrieval, or tool actions. A low aggregate can be mathematically correct and operationally irrelevant.
Users Experience Milestones and Stalls, Not Completion Alone
A chat turn has several clocks: queue wait, retrieval, first token, token cadence, tool wait, and final completion. Fast total time with a long silent opening can feel worse than a slightly longer response that begins promptly and streams evenly.
A latency analysis distinguishes time to first token from complete response time because these measures represent different parts of model behavior. Both are needed to describe an interactive turn.
Visible pauses also have order. A tool stall after several tokens interrupts attention differently from the same wait before the first token. An average across phases erases that interaction structure and directs optimization toward the wrong component.
Where Percentiles Still Mislead
Percentiles fail when the measurement tool stops issuing work during stalls, samples only completed requests, or aggregates unrelated time windows. This coordinated omission can undercount exactly the delays users encounter under load.
Gil Tene’s discussion of coordinated omission shows why load tests must preserve the intended request schedule instead of slowing submissions when the system slows. Otherwise latency distributions look artificially healthy.
The tail-latency explanation also stops applying if every phase trace is fast but users still report slowness. Interface rendering, network buffering, or delayed feedback may sit outside the measured server boundary. More percentile dashboards do not help when the clock starts too late or stops too early.

Trace the Milestones Users Actually Wait For
Instrument enqueue, execution start, retrieval finish, first token, each tool call, final token, and client render with one monotonic trace identifier. Report p50, p95, p99, maximum, and threshold-exceedance rate by interaction type and cold-versus-warm state.
Use AI cold starts traces to separate cold loading from steady-state inference. Keep failed and canceled turns in the dataset rather than excluding their waits.
Replay requests at a fixed intended schedule and compare client-visible with server-visible milestones. Optimize the phase responsible for the slow percentile. If server and client traces diverge, follow transport and rendering; if only cold turns spike, address loading rather than steady-state generation.

Recommended products

Tech & AI HUB
More to Read
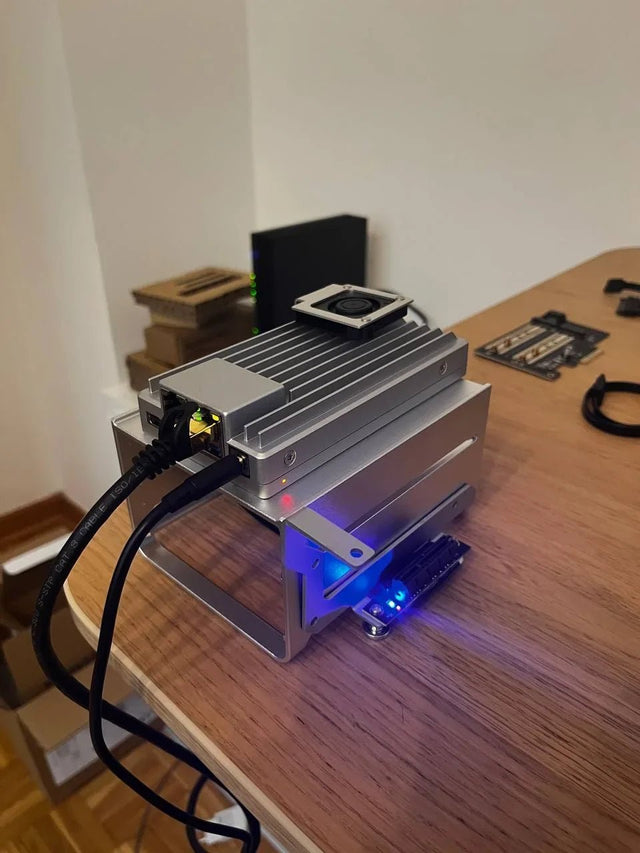
Why Does Local AI Heat Feel Different in an Open Shelf Than in a Closed Cabinet?
Trace heat generation, air exchange, and recirculation across open and enclosed placements, then measure the variables that distinguish them.
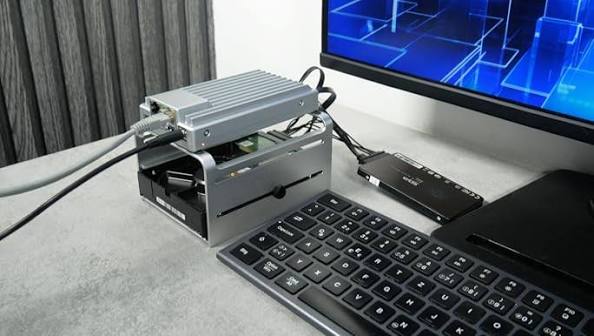
Why Does a Home Server Feel Quieter at Night Even at the Same Fan Speed?
Understand why unchanged fan speed does not guarantee unchanged perceived loudness and how to separate masking, room conditions, and real acoustic change.
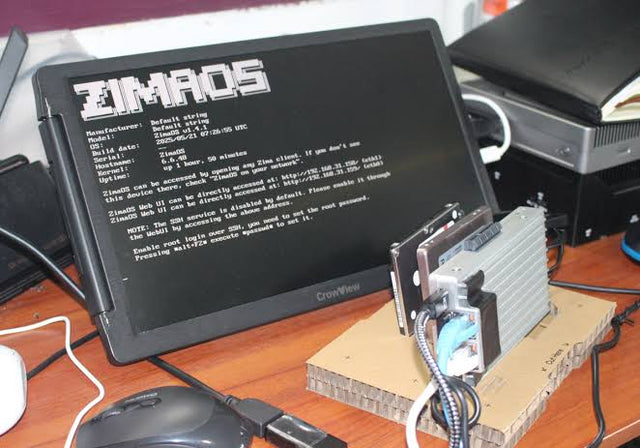
Why Do Deduplicated Backups Look Smaller Than Their Restore Footprint?
See how deduplication changes stored bytes but not restored meaning, why sparse and compressed files complicate totals, and how to size a restore test.


