
Bottom Line: Proxmox and ZimaOS Are Measuring Different Views of the Same Memory
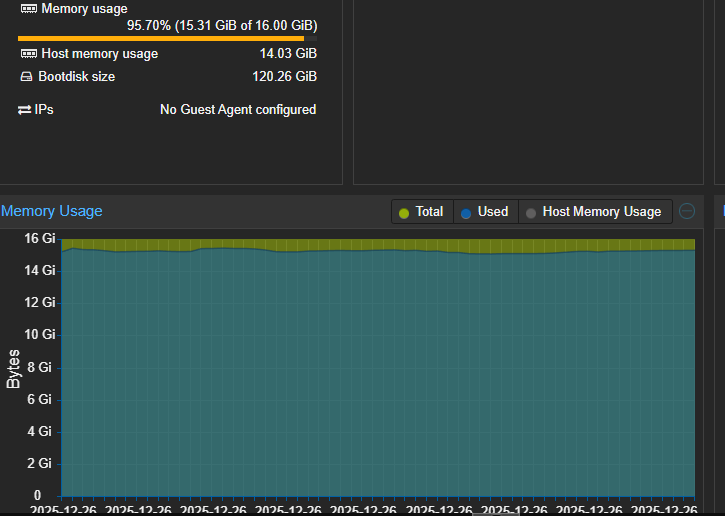
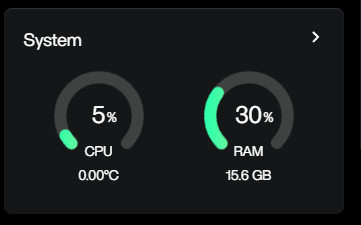
A Proxmox VM can look “95% full” while ZimaOS itself reports about 30% RAM in use. That does not automatically mean a leak. The host sees resident pages assigned to the VM, while the guest can classify a large part of RAM as reclaimable cache or otherwise available.
Do Not Blame the Missing QEMU Guest Agent for the Entire Difference
The screenshot says “No Guest Agent configured,” but the forum explanation overstates its role. QEMU Guest Agent improves host/guest communication, yet Proxmox uses the ballooning device for detailed guest-memory information. Proxmox explicitly recommends keeping the ballooning device enabled for memory reporting. See the Proxmox VM memory.
The ZimaOS on Proxmox gives the ZimaOS virtualization baseline.
Inside ZimaOS, Check Available Memory Before Calling It High Usage
free -h
cat /proc/meminfo | head -20
docker stats --no-stream
Focus on available, swap activity and which containers actually retain memory. Linux deliberately uses free RAM for filesystem cache; cached RAM is useful and can be reclaimed under pressure. The Linux memory accounting is the upstream reference.
When It Becomes a Real Memory Problem
Investigate further if available memory keeps falling, swap grows continuously, containers restart, the kernel logs OOM kills, or one process steadily grows over hours. A stable Proxmox percentage by itself is not enough.
The VM hardware requirements helps size the guest once you know the real working set.
Use One Monitoring Method for Trend Comparisons
For week-to-week diagnosis, do not compare a Proxmox host metric with a ZimaOS dashboard metric as though they were identical. Pick one layer and trend it consistently, then use the other layer only to explain anomalies.


