
Best 10 RAID Monitoring Tools for Home Servers


A RAID array can look healthy while one of its drives is quietly getting worse. It can also become degraded while the remaining disks still report SMART PASSED.
Good monitoring therefore needs more than one green status light. The best home-server setup watches the array, the physical drives, rebuilds or scrubs, and the alerts that tell you something changed.
RAID Monitoring Is More Than SMART
RAID health and disk health answer different questions.
An array monitor tells you whether the storage system still has the expected members, whether redundancy has been lost, and whether a rebuild, resync, scrub, or consistency operation is running.
SMART monitoring looks underneath that array at individual HDDs, SSDs, and NVMe drives. It can expose temperature, media errors, pending sectors, reallocated sectors, endurance, self-test results, and other device-level signals.
RAID Monitoring
     |
     +-- Array State
     |     Healthy / Degraded / Offline
     |
     +-- Drive Health
     |     SMART / NVMe / Temperature
     |
     +-- Recovery
     |     Rebuild / Resync / Scrub
     |
     +-- History
     |     Trends / Errors / Capacity
     |
     +-- Alerts
           Email / Push / Webhook / Chat
The distinction matters because a healthy array can contain a deteriorating drive, while a degraded array can still contain several individual disks whose SMART status remains normal.
The underlying RAID model is covered in more detail in how RAID works, but monitoring starts from a simpler rule: watch both the array and the drives underneath it.
What Should a RAID Monitoring Tool Actually Watch?
A useful home-server monitor should cover as many of these layers as its role requires:
| Layer | Important Signals | Why It Matters |
|---|---|---|
| Array state | Healthy, degraded, offline, missing member | Shows whether redundancy still exists |
| Physical drives | SMART, temperature, NVMe health, wear | Can reveal a disk deteriorating before array failure |
| Recovery | Rebuild, resync, resilver, scrub, consistency check | Shows whether redundancy is being restored or verified |
| Errors | I/O errors, checksum errors, uncorrectable sectors | Provides evidence that storage reliability is changing |
| Capacity | Pool, filesystem, and drive usage | Prevents space exhaustion from becoming an outage |
| History | Temperature, SMART attributes, error trends | Shows gradual deterioration instead of one current snapshot |
| Alerts | Email, webhook, push, chat, escalation | A dashboard is useless if nobody opens it after a failure |
How We Ranked the Best RAID Monitoring Tools
This is not a ranking of the prettiest dashboards. The tools below solve different parts of the monitoring stack.
We evaluated them around five practical questions:
- What can it actually observe? Array state, individual disks, ZFS pools, hardware RAID, or the whole server?
- Does it preserve history? A slowly rising error count is often more useful than one current value.
- Can it alert without manual checking? Monitoring should surface problems proactively.
- How difficult is it to deploy? A single home NAS should not require enterprise observability infrastructure unless the user wants it.
- Does it complement native RAID tooling? The strongest setups usually combine an array-specific monitor with a disk-health layer.
The numerical order is editorial rather than a synthetic benchmark score.
10 Best RAID Monitoring Tools for Home Servers at a Glance
| Rank | Tool | Best For | Array Health | Drive Health | History | Difficulty |
|---|---|---|---|---|---|---|
| 1 | Netdata | One home-server dashboard | Yes | Yes | Yes | Low to Medium |
| 2 | Scrutiny | SMART health trends | No | Excellent | Excellent | Low |
| 3 | smartmontools | Foundational disk monitoring | No | Excellent | Limited without another layer | Low |
| 4 | mdadm Monitor | Linux software RAID | Excellent | No | Event-oriented | Low |
| 5 | OpenZFS ZED | ZFS pool events | Excellent for ZFS | Indirect | Event-oriented | Low to Medium |
| 6 | Cockpit Storage | Beginner-friendly Linux GUI | Yes | Yes | Limited | Low |
| 7 | Prometheus + Grafana | Long-term custom metrics | With exporters | Excellent | Excellent | High |
| 8 | Checkmk | Multiple home servers | With checks/plugins | Yes | Yes | Medium |
| 9 | StorCLI | LSI/Broadcom hardware RAID | Excellent | Excellent for controller drives | CLI-oriented | Medium |
| 10 | Zabbix | Advanced custom alerting | With templates/scripts | Yes | Excellent | High |
1. Netdata — Best Overall RAID Monitoring Dashboard
Netdata is the strongest overall choice when you want one monitoring layer for the storage system and the rest of the home server.
Its current storage collectors cover several architectures relevant to RAID users.
For Linux software RAID, the MD RAID collector reads /proc/mdstat and tracks MD devices. For physical drives, Netdata has a SMART collector based on smartctl. Its ZFS pool collector monitors pool health and space through zpool, while its StoreCLI RAID collector can monitor supported hardware RAID adapters, physical drives, and backup batteries.
That breadth gives Netdata an advantage over narrowly focused SMART dashboards.
MD RAID
SMART
ZFS
Hardware RAID
Filesystems
CPU
RAM
Network
Containers
     |
  Netdata
     |
One Dashboard
A single Netdata Agent can run independently and expose its local dashboard on port 19999. Cloud connectivity is optional for the monitoring agent itself, although Netdata Cloud adds centralized views and additional multi-node functionality.
This makes Netdata particularly useful on a home server where storage monitoring should live beside system load, RAM pressure, filesystem capacity, Docker activity, and network performance.
Best for: users who want one dashboard covering RAID plus the rest of the server.
Trade-off: Netdata is broad rather than obsessively disk-focused. Scrutiny provides a cleaner view when the goal is studying SMART attributes and long-term physical-drive deterioration.
2. Scrutiny — Best for Spotting Drive Health Trends

Scrutiny is one of the most useful additions to a home NAS because it solves several weaknesses of raw SMART monitoring.
SMART exposes a large number of attributes, but not every attribute is equally useful. Manufacturer thresholds can also be conservative enough that a drive may look “healthy” until failure is relatively close.
Scrutiny combines SMART data with a Web UI, historical trend storage, temperature tracking, and additional thresholds informed by real-world drive-failure data.
That allows questions such as:
Current Pending Sectors

January       0
March         0
June          2
August        8
A single current SMART report tells you the value is eight. Scrutiny tells you that the metric has been moving in the wrong direction.
It also supports configurable notifications through email, webhooks, ntfy, Gotify, Slack, Discord, Telegram, and other services.
RAID-controller support depends on whether smartctl can reach the underlying physical drives. Scrutiny documents controller passthrough and Docker device mapping for that reason.
The important limitation is equally clear:
Scrutiny monitors drives, not the RAID array itself.
A Linux MD array should still be monitored with mdadm or another array-aware layer. A ZFS pool should still have ZFS-specific monitoring.
Best for: home servers with multiple HDDs or SSDs where historical SMART and temperature trends matter.
Trade-off: do not mistake a row of healthy disks in Scrutiny for proof that the RAID array is healthy.
The drive-health layer also depends on the drives themselves. Choosing suitable NAS drives reduces avoidable problems during rebuilds and continuous 24/7 workloads.
3. smartmontools — Best Foundation for HDD, SSD, and NVMe Monitoring
smartmontools is much less visually exciting than Scrutiny, but it is more fundamental.
The project provides two core tools:
smartctl
   |
Inspect and test a drive

smartd
   |
Continuously monitor drives
smartctl can inspect SMART and health information from ATA/SATA, SCSI/SAS, and NVMe devices and trigger drive self-tests. smartd runs as a daemon and continuously checks devices for configured health conditions.
Many higher-level monitoring products ultimately depend on this data. Netdata's SMART collector requires smartmontools, Scrutiny builds its disk-health layer around smartctl data, and Prometheus smartctl exporters use the same interface.
The project is also still evolving. The current upstream changelog lists smartmontools 8.0 as the next unreleased generation following 7.5.
For a lightweight home server, smartd may be all that is needed:
Drive
  |
SMART
  |
smartd
  |
Alert
You do not necessarily need a separate database, dashboard, and metrics stack to learn that a drive has crossed an important threshold.
Best for: users who want a lightweight, mature foundation for physical drive health and automated tests.
Trade-off: command-line output is less approachable than Scrutiny or Cockpit, and smartd by itself does not provide the same visual historical analysis.
4. mdadm Monitor — Best Native Monitor for Linux Software RAID
If the array is Linux MD RAID, mdadm should remain part of the monitoring plan even if Netdata or another dashboard is installed.
mdadm --monitor understands the array itself.
It can report events such as:
- device failure;
- degraded arrays;
- spare activation;
- device disappearance;
- rebuild start;
- rebuild progress;
- rebuild completion.
That fills the gap left by SMART:
smartd
  |
Are the drives healthy?

mdadm --monitor
  |
Is the RAID array healthy?
For a minimal Linux home server, combining mdadm monitoring with smartd creates a surprisingly capable monitoring system without adding a large Web stack.
Best for: Debian, Ubuntu, and other Linux servers built around MD RAID 1, 5, 6, or 10.
Trade-off: mdadm focuses on Linux software RAID rather than ZFS, hardware RAID, or graphical long-term analysis.
5. OpenZFS ZED — Best Native Event Monitoring for ZFS Pools
ZFS users should monitor ZFS as ZFS rather than trying to map every event onto traditional RAID terminology.
ZED, the ZFS Event Daemon, monitors events generated by the ZFS kernel module and runs configured ZEDLET actions when matching event classes appear.
The monitoring relationship becomes:
ZFS Kernel
    |
  zevents
    |
   ZED
    |
ZEDLET Actions
    |
Notifications / Automation
This makes ZED appropriate for pool and device events that belong to ZFS itself rather than an external disk dashboard.
A complete ZFS home-server stack may therefore include:
ZED
 |
Pool events

smartd / Scrutiny
 |
Physical drive health

Netdata / Grafana
 |
Dashboard and history
Best for: TrueNAS-style, OpenZFS, or Linux/BSD ZFS users who want native event handling around their pools.
Trade-off: ZED is an event daemon, not a polished all-in-one dashboard. Pair it with another layer if long-term visualization matters.
6. Cockpit Storage — Best RAID Monitoring GUI for Linux Beginners
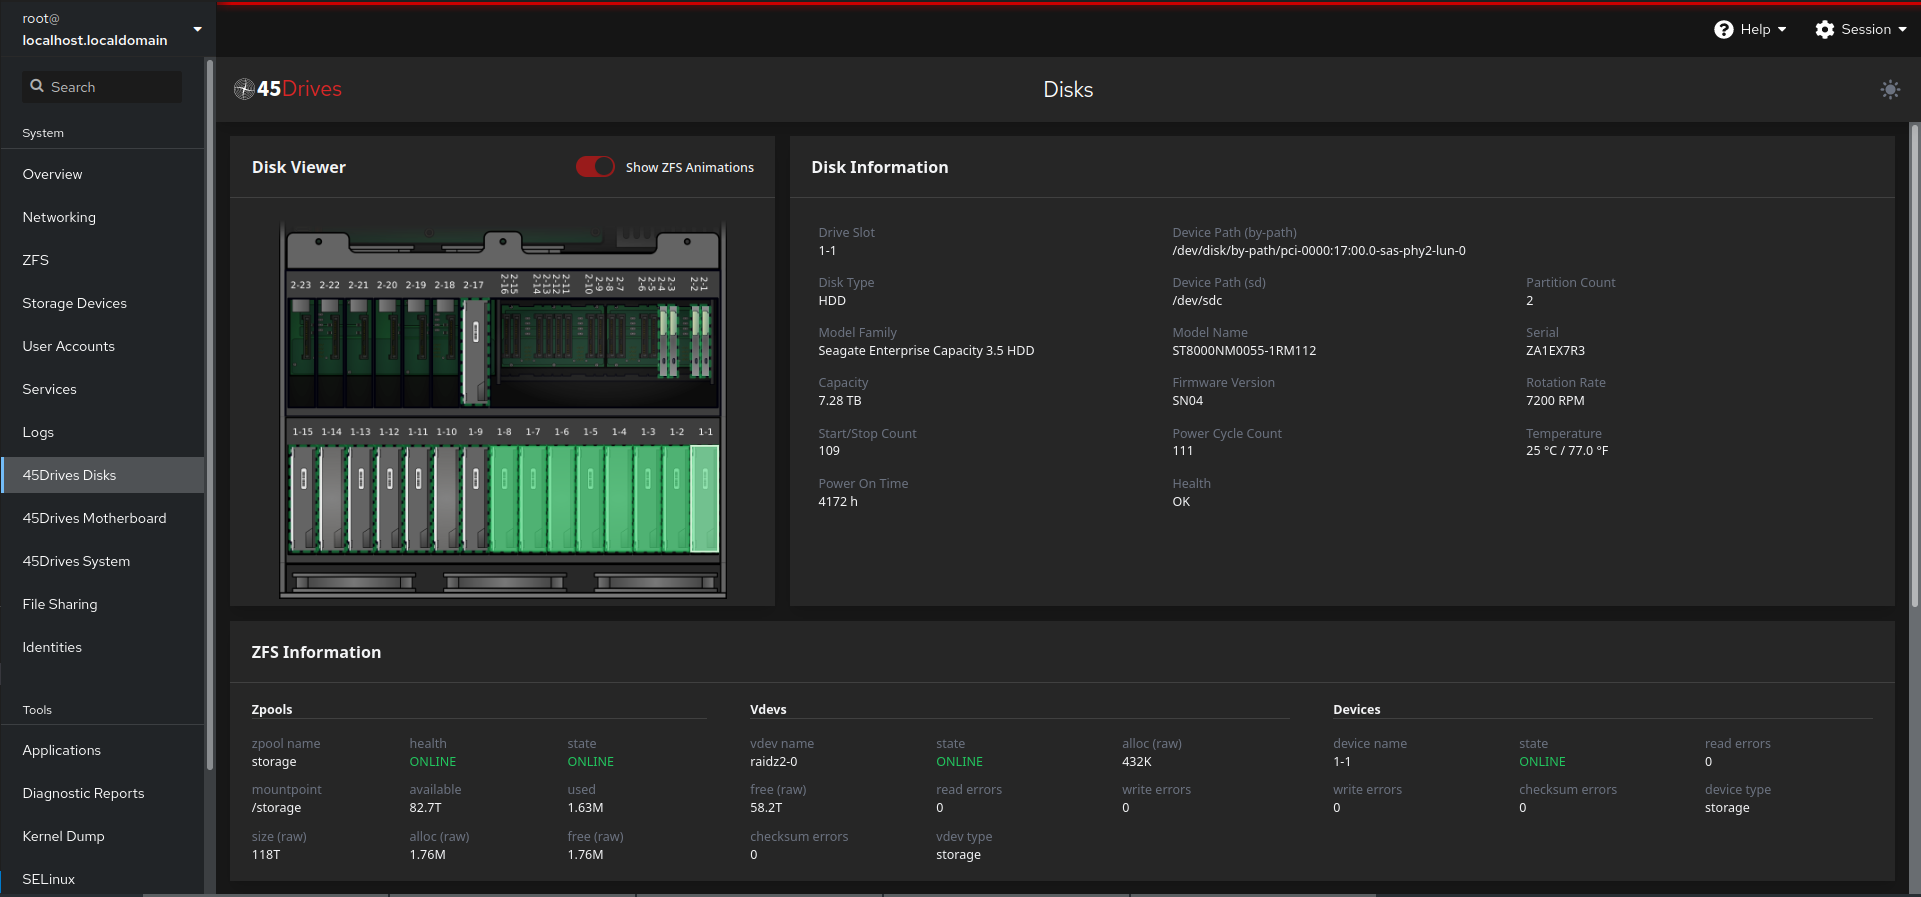
Cockpit is one of the easiest ways to add a browser-based administration interface to a normal Linux server.
Its Storage application supports local disks, partitions, RAID, encryption, NFS, iSCSI, and other common storage operations.
Cockpit also added SMART device-health information to the Storage page, including the ability to run disk self-tests from the browser.
That makes it a strong beginner option for a server that otherwise looks like this:
Ubuntu / Debian / Fedora
          |
       Cockpit
          |
 Browser Storage UI
          |
 RAID + SMART + Mounts
It is especially useful when the user wants to manage storage rather than build a dedicated observability stack.
Best for: Linux beginners who want RAID and disk status inside a clean server-management UI.
Trade-off: Cockpit is better at showing and managing current server state than at storing months of detailed SMART history.
7. Prometheus + smartctl_exporter + Grafana — Best for Long-Term Metrics
When monitoring becomes a hobby of its own, the Prometheus stack gives you far more control than a purpose-built NAS dashboard.
The official smartctl_exporter converts smartctl statistics into Prometheus metrics. It requires smartmontools 7.0 or newer because it depends on smartctl's JSON output.
The architecture is modular:
SMART / RAID / ZFS Exporters
           |
       Prometheus
           |
         Grafana
           |
 Dashboards + Alerting
Additional exporters or node metrics can add:
- filesystem capacity;
- disk I/O;
- ZFS pools;
- MD RAID state;
- temperature;
- server load;
- UPS metrics;
- network activity.
This is the strongest option when you want to answer historical questions rather than simply check current health.
For example:
- Did drive temperature rise during the last RAID rebuild?
- When did uncorrectable errors first appear?
- Did storage latency change after adding another drive?
- How fast has pool utilization grown over the last year?
Grafana Alerting can also evaluate Prometheus-based rules and route notifications when conditions are met.
Best for: enthusiasts who want long-term metrics, custom dashboards, correlation, and flexible alerts.
Trade-off: Prometheus + exporters + Grafana requires substantially more configuration than Scrutiny or Netdata. For one simple home NAS, that complexity may produce little practical benefit.
8. Checkmk — Best for Monitoring Multiple Home Servers
Checkmk becomes more attractive when the home lab contains more than one machine.
Instead of thinking only about a NAS, you may have:
NAS
Backup Server
Proxmox Host
Mini PC
Router
UPS
Switch
     |
   Checkmk
The Checkmk Linux agent supports hardware monitoring through plugins, including SMART values from modern HDDs and SSDs.
Its documentation also explicitly accounts for drives hidden behind supported RAID controllers. Depending on the controller, tools such as smartmontools, tw_cli, or MegaRAID utilities may be required before Checkmk can access the underlying device information.
The larger advantage is centralized operations: multiple hosts, service states, alert rules, graphs, inventory, capacity, and system monitoring can all live in one interface.
Best for: home labs where storage health needs to be monitored alongside several Linux servers and infrastructure devices.
Trade-off: Checkmk is unnecessary overhead for a single NAS if Netdata or native OS monitoring already covers the important failure signals.
9. StorCLI — Best for LSI and Broadcom Hardware RAID
Hardware RAID requires a different monitoring mindset because the operating system may see one virtual disk while the controller manages several physical drives underneath it.
Operating System
      |
 Virtual Drive
      |
 RAID Controller
      |
+-----+-----+-----+
Disk 1   Disk 2  Disk 3
StorCLI is Broadcom's command-line management utility for supported LSI/Broadcom RAID controllers.
It can inspect controller state, virtual drives, physical drives, rebuild operations, enclosure information, cache, and supported battery or backup components.
Hardware RAID status can include states such as:
- Optimal;
- Partially Degraded;
- Degraded;
- Offline.
That controller-level visibility is essential because generic SMART tooling may not be able to discover member drives automatically through every RAID controller.
A useful monitoring combination is:
Broadcom / LSI RAID
        |
      StorCLI
        |
     Netdata
        |
Dashboard + Alerts
Netdata's StoreCLI collector can consume controller information and place it beside the rest of the server metrics.
Best for: home servers using supported Broadcom, LSI, or MegaRAID hardware controllers.
Trade-off: StorCLI is controller-specific administration tooling rather than a universal home-server dashboard.
10. Zabbix — Best for Advanced RAID Alerting and Automation
Zabbix is the most infrastructure-oriented option in this list.
Its current Agent 2 templates include official SMART monitoring, while array and controller state can be added through supported integrations, custom items, scripts, or templates appropriate to the environment.
A larger Zabbix deployment can combine:
SMART
RAID
ZFS
Filesystem
UPS
Temperature
Network
Services
     |
   Zabbix
     |
History
Triggers
Notifications
Escalation
The strength is not a purpose-built RAID screen. It is the ability to define exactly what constitutes a failure and what should happen next.
For example, one warning could be routed to a normal notification channel while a degraded array or offline virtual disk triggers a more urgent escalation.
Best for: advanced users who already run Zabbix or want detailed multi-system alert rules and automation.
Trade-off: setup complexity is high. Installing Zabbix solely to monitor two disks in one home NAS is usually unnecessary.
Which RAID Monitoring Tool Should You Actually Use?
| If You Want... | Start With | Why |
|---|---|---|
| One dashboard for a home server | Netdata | Covers MD RAID, SMART, ZFS, hardware RAID, and system metrics |
| Detailed disk-health history | Scrutiny | Focused SMART trends, temperature, thresholds, and notifications |
| Lightweight disk monitoring | smartmontools | Mature command-line tools without a large monitoring stack |
| Linux software RAID events | mdadm Monitor | Understands MD array failures, rebuilds, and degraded states |
| ZFS pool events | OpenZFS ZED | Native event daemon for ZFS |
| A simple Linux storage GUI | Cockpit | RAID management and SMART health in the browser |
| Long-term custom dashboards | Prometheus + Grafana | Flexible metrics, history, correlation, and alerts |
| Several home servers | Checkmk | Centralizes host, service, disk, and infrastructure monitoring |
| LSI/Broadcom hardware RAID | StorCLI | Reads controller, virtual-drive, and physical-drive state directly |
| Complex alert automation | Zabbix | Flexible triggers, templates, history, and escalation |
RAID Health vs SMART Health: They Are Not the Same
This distinction is more important than the choice between most tools in the ranking.
| Signal | What It Tells You | What It Does Not Tell You |
|---|---|---|
| RAID Healthy | The array currently has the required members | Every drive will remain healthy |
| RAID Degraded | Redundancy or expected membership has been lost | The exact physical cause in every case |
| SMART PASSED | The drive has not crossed its SMART failure state | That every attribute is ideal |
| Pending sectors | Sectors are waiting for successful reread or remapping | The complete health of the RAID array |
| Reallocated sectors | The drive has remapped unusable sectors | Whether the array still has redundancy |
| Temperature | Current or historical thermal conditions | Whether the filesystem is consistent |
| Rebuild progress | How far redundancy restoration has progressed | Whether old backups are recoverable |
| ZFS checksum errors | ZFS detected integrity problems | Every underlying mechanical failure mode |
A useful example is:
mdadm:
Array Healthy

Scrutiny:
Disk 3
Current Pending Sector = 0 → 2 → 8
The array has not failed yet, but the physical-drive history gives you a reason to investigate.
The opposite can also happen:
mdadm:
Array Degraded

smartctl:
Disk 1 PASSED
Disk 2 PASSED
Disk 3 PASSED
The missing member may have disappeared because of cabling, power, controller problems, device enumeration, or another fault not represented by a SMART failure threshold.
mdadm vs ZFS vs Hardware RAID Monitoring
The correct monitoring tool depends partly on where RAID logic lives.
| Storage Architecture | Native Monitor | Useful Second Layer |
|---|---|---|
| Linux MD RAID | mdadm | Scrutiny / Netdata |
| OpenZFS | ZED / zpool | Scrutiny / Netdata / Grafana |
| LSI/Broadcom Hardware RAID | StorCLI | Netdata / Checkmk |
| NAS appliance RAID | NAS OS built-in monitoring | SMART/history tool when supported |
This is why the storage layout affects monitoring architecture. Software RAID, ZFS, and hardware RAID expose different states through different control layers.
Scrutiny vs Netdata: Which One Should You Install?
They work better together than against each other.
| Area | Scrutiny | Netdata |
|---|---|---|
| Main focus | Physical-drive health | Whole-server monitoring |
| SMART history | Excellent | Available as metrics |
| Temperature trends | Excellent | Yes |
| MD RAID state | No | Yes |
| ZFS pool state | No | Yes |
| Hardware RAID | SMART passthrough dependent | StoreCLI collector |
| CPU / RAM / network | No | Yes |
| Best role | Disk specialist | Server dashboard |
A straightforward home-server combination is therefore:
Netdata
  |
Array + Server Health

Scrutiny
  |
Physical Drive Trends
If you only want one application, Netdata covers more layers.
If the NAS operating system already monitors array health well, Scrutiny may add more new information because it gives the physical disks a better historical view.
Do You Need Prometheus and Grafana for a Home NAS?
Usually not.
If the only requirement is:
Tell me when RAID is degraded
Tell me when a disk is failing
native array alerts plus smartd, Scrutiny, or Netdata can solve the problem with much less infrastructure.
Prometheus and Grafana start to make sense when you care about:
- months or years of history;
- multiple servers;
- custom dashboards;
- correlating temperature with I/O;
- tracking storage growth;
- combining RAID with UPS, network, Docker, and host metrics;
- custom PromQL alert rules.
The wrong reason to install Grafana is simply that the dashboard looks impressive.
The right reason is that you have questions that require time-series history.
What RAID Alerts Should You Configure?
Monitoring becomes useful only when something can reach you without you opening the dashboard first.
Array Alerts
- array degraded;
- array offline;
- unexpected member missing;
- spare activated;
- rebuild or resync started;
- rebuild failed;
- rebuild completed.
Physical Drive Alerts
- SMART overall health failure;
- Current Pending Sector Count increases;
- Offline Uncorrectable increases;
- Reallocated Sector Count increases materially;
- NVMe critical warning;
- SSD endurance or wear approaching replacement level;
- drive temperature remains outside the expected range.
ZFS Alerts
- pool degraded;
- device fault;
- checksum errors increase;
- scrub discovers errors;
- resilver starts or fails;
- pool capacity approaches the chosen threshold.
Hardware RAID Alerts
- physical drive failed;
- virtual drive degraded;
- virtual drive offline;
- rebuild stalled or failed;
- controller cache or backup-battery fault.
The exact temperature and SMART thresholds should not be copied blindly from another server. Different drive models expose different attributes and operating ranges.
The principle is more important:
A dashboard you never open is not monitoring.
SMART Test vs Scrub vs Rebuild: Three Different Jobs
These operations are commonly mixed together, but they inspect different things.
SMART Self-Test
A SMART self-test is performed by an individual storage device.
One Drive
   |
SMART Test
   |
Device-Level Result
A long SMART test can scan more of the drive surface than a short test, but it does not verify the RAID's parity or ZFS's copies of data across the whole storage system.
RAID Rebuild or Resync
A rebuild restores redundancy after a failed or replaced member.
Degraded RAID
     |
Replacement Drive
     |
Rebuild / Resync
     |
Redundancy Restored
It is a recovery operation, not a disk-health test.
ZFS Scrub or RAID Consistency Check
A scrub or consistency operation verifies data and redundancy relationships that already exist.
It answers a different question:
> Does the stored data still match the integrity and redundancy information the storage system expects?This is why monitoring should expose all three when the storage architecture supports them.
Enable Native NAS Alerts Before Installing Another Dashboard
A dedicated NAS operating system may already provide the first monitoring layer you need.
For example, current ZimaOS storage management shows array status, drive health, usable capacity, and read/write speeds under Settings > Storage. A failed RAID member changes the array to a degraded state, and the recovery workflow guides the user through rebuilding after drive replacement.
ZimaOS also exposes long-running RAID and parity-check progress and detailed disk-health information in its storage interface.
The practical order should therefore be:
1. Enable native NAS alerts
        |
2. Confirm degraded-array detection
        |
3. Add physical-drive history
        |
4. Add larger observability stack only if useful
TrueNAS, Unraid, Synology, QNAP, and other NAS platforms similarly provide native storage-health features that should be configured before adding a second monitoring system.
The extra layer should answer a question the native UI does not answer well.
RAID Monitoring Does Not Replace Backup
A perfect alert can tell you a disk failed within seconds.
It cannot restore yesterday's version of a deleted folder.
It cannot recover files already encrypted by ransomware.
It cannot recreate the NAS after theft, fire, or a catastrophic controller failure.
That is why RAID is not a backup.
RAID
  |
Availability after some drive failures

Monitoring
  |
Detect problems quickly

Backup
  |
Recover lost or damaged data
All three solve different parts of the reliability problem.
Monitoring becomes especially important during rebuilds because the remaining drives can experience sustained activity while redundancy is reduced. Unexpected power loss during that period adds another risk, which is why UPS protection during storage operations matters independently from drive-health monitoring.
Recommended RAID Monitoring Stacks
Simple Linux RAID Server
mdadm --monitor
       +
     smartd
This is the lightweight option.
mdadm watches the Linux array. smartd watches the disks. Neither requires a heavyweight Web platform.
Easy Home NAS
Native NAS Monitoring
         +
      Scrutiny
The NAS interface handles array state and rebuilds, while Scrutiny adds drive-health history and notifications.
General Linux Home Server
Netdata
   +
Scrutiny
Netdata provides array and whole-server monitoring. Scrutiny provides deeper physical-drive history.
ZFS Home Server
ZED
 +
Scrutiny
 +
Netdata
ZED handles native ZFS events, Scrutiny watches drive trends, and Netdata gives the system a broader dashboard.
Advanced Homelab
smartctl_exporter
MD / ZFS exporters
node_exporter
      |
  Prometheus
      |
   Grafana
      |
Alerting
This is appropriate when metrics history and multiple servers matter enough to justify maintaining a full observability stack.
Hardware RAID Server
StorCLI
   |
Netdata / Checkmk
   |
Alerts + Dashboard
The controller utility remains the source of truth for the hardware RAID layer while the monitoring platform makes its state visible and actionable.
Final Verdict
Netdata is the best overall RAID monitoring tool for most home servers because it can sit above several storage architectures while also monitoring the host itself.
Scrutiny is the strongest companion tool when individual-drive history matters. It is particularly useful for noticing slow changes in SMART attributes before the array itself reaches a degraded state.
smartmontools remains the foundational disk-health layer, while mdadm Monitor is still one of the cleanest answers for Linux software RAID.
OpenZFS ZED should remain part of a ZFS-native monitoring strategy rather than trying to replace pool events with generic SMART data.
Cockpit is the easiest graphical option for a normal Linux server, while Prometheus and Grafana make more sense once long-term metrics become a real requirement.
Checkmk and Zabbix become more valuable as the number of monitored systems grows, and StorCLI is essential when the RAID logic lives inside supported LSI/Broadcom hardware.
The most reliable home-server strategy is therefore layered:
Array State
     +
Drive Health
     +
Recovery Status
     +
Alerts
     +
History
RAID usually fails in layers, so monitoring should be layered too.
FAQ
What is the best RAID monitoring tool for a home server?
Netdata is one of the best overall options because it can monitor Linux MD RAID, SMART devices, ZFS pools, supported hardware RAID, and the rest of the server from one interface. Scrutiny is a stronger specialist tool when detailed physical-drive SMART history is the priority.
Is Scrutiny a RAID monitoring tool?
Scrutiny monitors the physical drives underneath a RAID array through SMART data. It does not replace array-level monitoring such as mdadm for Linux MD RAID, ZED for ZFS events, or StorCLI for supported hardware RAID controllers.
Can SMART say PASSED when a drive is failing?
SMART PASSED means the drive has not crossed the device's overall SMART failure condition. Individual attributes can still change in concerning ways before that state flips to failed. Historical monitoring is useful because it makes those trends visible.
What is the best way to monitor mdadm RAID?
Use mdadm's monitoring mode for array events and pair it with smartmontools or Scrutiny for physical-drive health. Netdata can provide an additional graphical MD RAID and server monitoring layer.
What is the best way to monitor a ZFS pool?
Use ZFS-native tools such as ZED and zpool for pool events and state. Add smartmontools or Scrutiny for individual-drive health and Netdata, Prometheus, or Grafana when historical visualization is required.
Does RAID monitoring detect a failing hard drive before failure?
Array monitoring alone may not. SMART-based tools can expose changing drive-health attributes before the array loses a member, although no monitoring system can predict every drive failure reliably.
Should I use Netdata or Scrutiny?
Use Netdata when you want one whole-server dashboard covering RAID, storage, CPU, RAM, network, and services. Use Scrutiny when detailed SMART trends and drive-health history are the priority. Running both can be useful because they cover different layers.
Do I need Grafana to monitor RAID?
No. Grafana is useful for long-term metrics, custom dashboards, multiple systems, and correlation. A simple home NAS can often be monitored adequately with its native alerts plus smartmontools, Scrutiny, or Netdata.
What alerts should a RAID server send?
At minimum, configure alerts for degraded or offline arrays, missing members, rebuild failures, SMART health failures, important SMART attribute changes, high drive temperatures, ZFS errors, and hardware RAID controller or cache faults where applicable.
Is a RAID scrub the same as a SMART test?
No. A SMART test operates on an individual drive. A scrub or consistency check validates data and redundancy at the storage-system level. A rebuild restores redundancy after a disk failure or replacement.
Does RAID monitoring replace backup?
No. Monitoring helps detect failures quickly, and RAID can maintain availability after certain drive failures. Neither restores deleted, encrypted, corrupted, or historically changed files. A separate backup remains necessary.
Should I monitor SSDs and NVMe drives in RAID?
Yes. SSDs and NVMe drives expose health information such as critical warnings, temperature, media errors, and endurance or wear. The exact attributes differ from HDD SMART data, so the monitoring tool needs appropriate device support.

Recommended products

Product Comparisons
More to Read
Can Home Assistant Replace openHAB for Whole-Home Device Control?
Home Assistant can replace openHAB only when every essential device and automation passes a parallel migration and rollback test.
Mini PC vs Single-Board Server vs NAS for Home Assistant
Pick an SBC for a small efficient appliance, a mini PC for flexible headroom, or a NAS only when shared-host operations are already mature.
How to Choose Between a Dedicated Home Assistant Server and a Shared App Host
Choose dedicated hosting for simpler failure isolation; choose a shared host when isolation, maintenance windows, and recovery are proven.


