
High CPU use during the first Jellyfin library scan can be expected, but a server pinned near 100% for multiple days while the Jellyfin interface only shows a loading spinner is a different situation. In this March 2026 ZimaOS thread, the user had added roughly 90 GB of video and was still seeing high CPU usage on the second day.
The thread did not end with a confirmed root cause, so this page should be used as a diagnostic guide rather than a solved-case recipe.
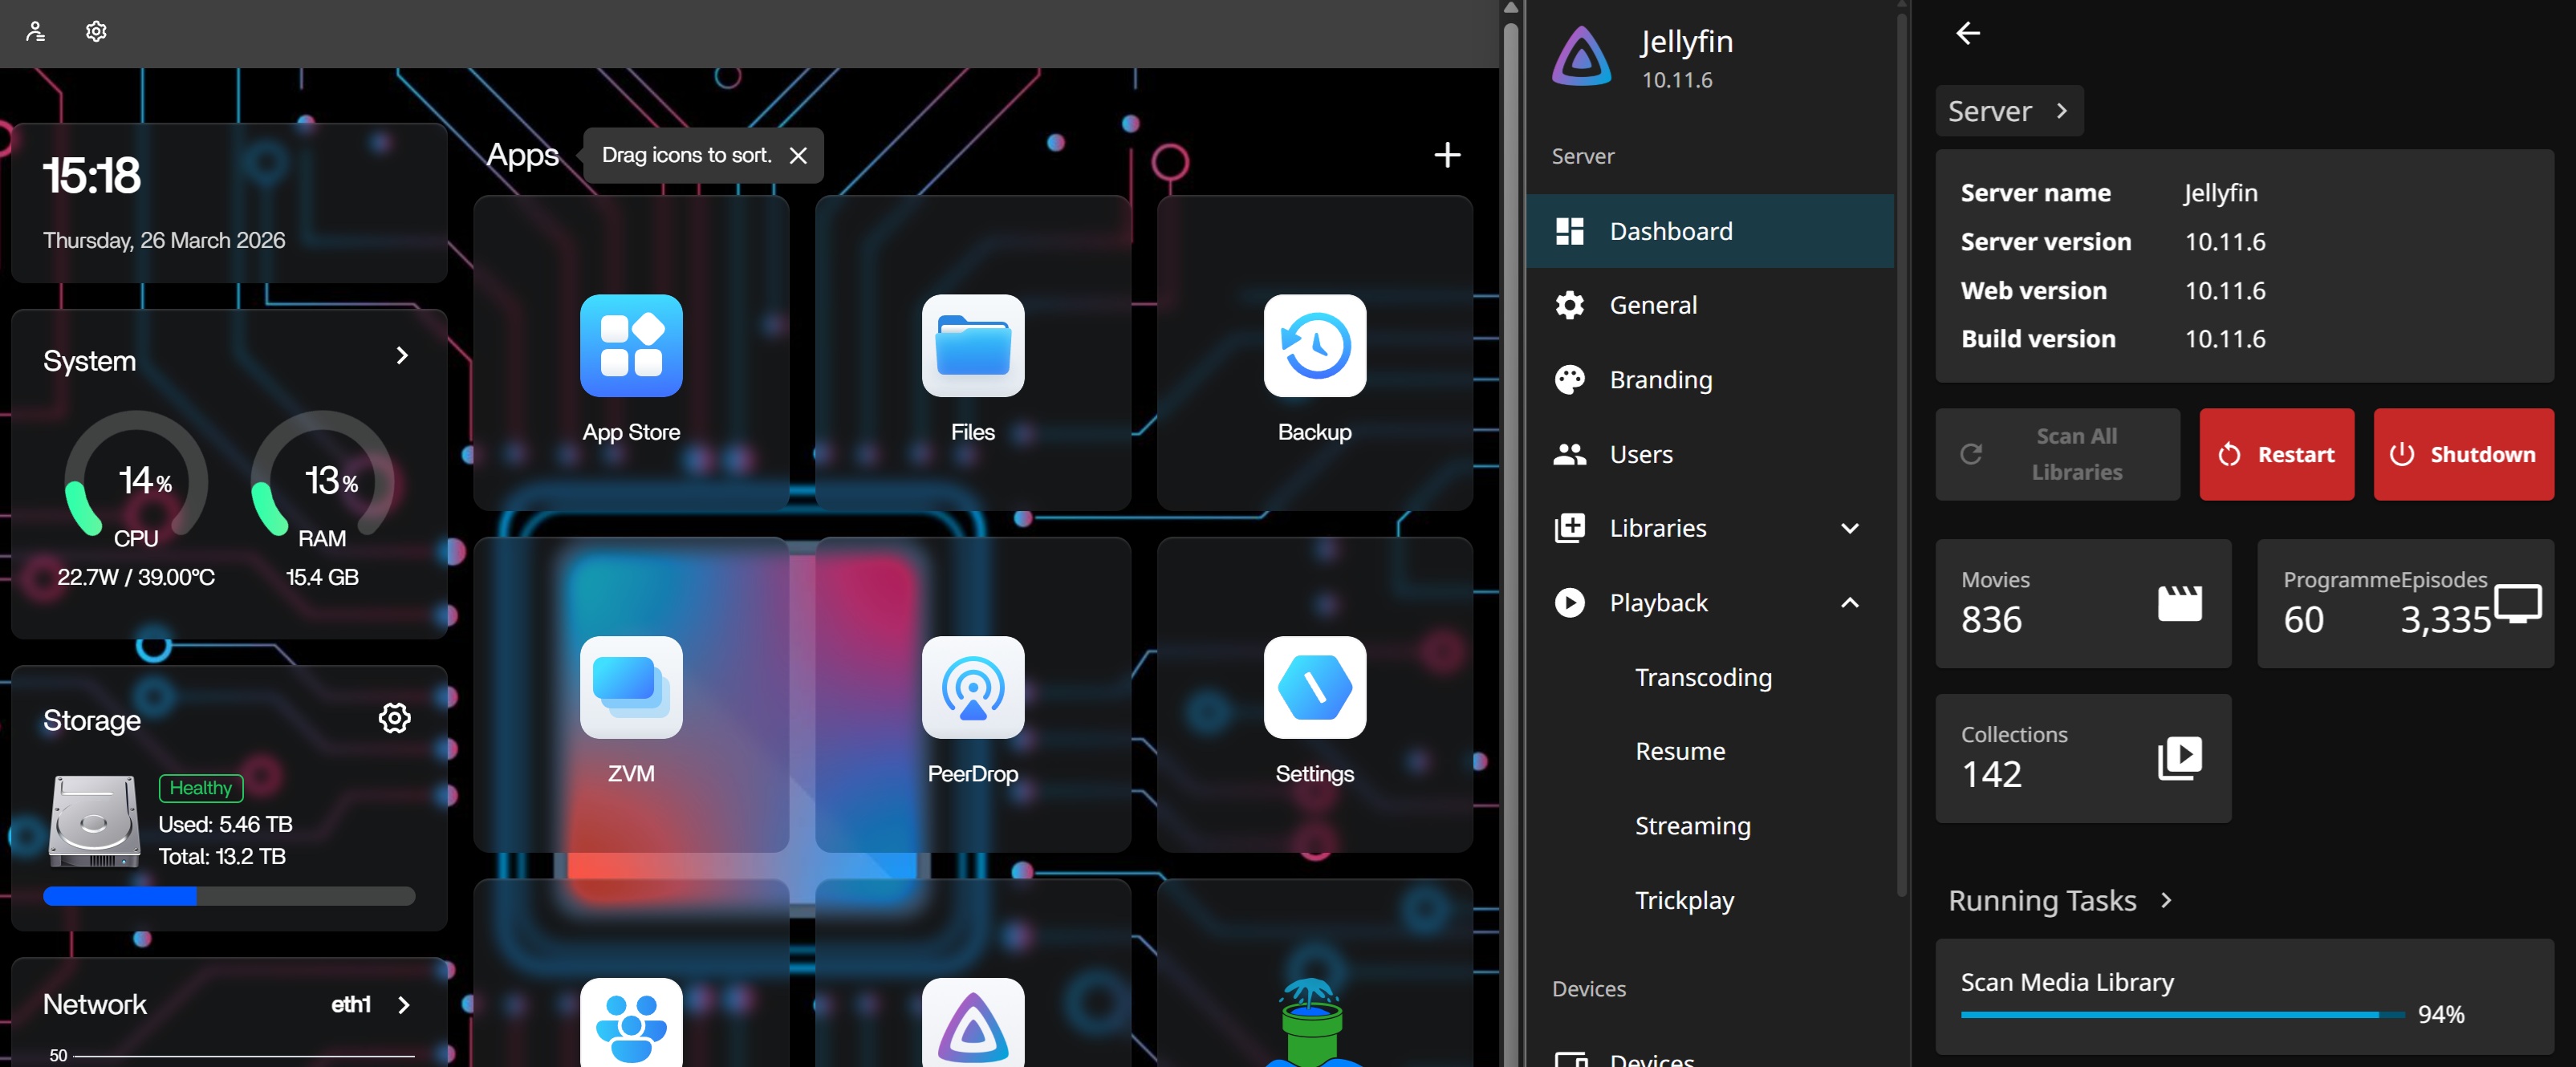
Hours of Initial Work Can Be Normal; Days Plus a Frozen UI Are Not
Other community users challenged the idea that two days of sustained full CPU usage was normal indexing. One respondent reported much lower scan utilization on older hardware, while another summarized the case as likely stuck because Jellyfin was both consuming CPU and failing to load.
That distinction is more useful than any fixed CPU percentage. Library size, thumbnails, chapter images, metadata downloads, codec probing, and storage speed can all change how much work a first scan performs.
Jellyfin Runs More Than a Simple File Index
Current Jellyfin documentation lists scheduled tasks such as library scanning, chapter-image extraction, key-frame extraction, subtitle downloads, database optimization, cache cleanup, and other maintenance operations.
which background tasks Jellyfin can run
If the CPU remains high long after media discovery should have stabilized, review which background task is actually running instead of assuming the server is still performing a normal library scan.
Preview and Chapter Image Generation Can Be Expensive
A community reply suggested temporarily disabling preview-thumbnail and chapter-image generation to see whether CPU use falls. That was a troubleshooting suggestion, not a confirmed fix for the original poster.
Current Jellyfin task documentation confirms that chapter-image and key-frame extraction are real background jobs, so they are valid areas to inspect when startup processing seems unusually long.
Unavailable or Sleeping Storage Can Keep Media Work Failing
The thread also raised USB or DAS sleep/disconnection as a possible cause. If a media path disappears or becomes intermittently unavailable, repeated scans and failed media access can look like an indexing problem.
Verify that every library path remains mounted and responsive before changing Jellyfin versions or rebuilding the application.
Transcoding and Hardware Acceleration Are a Separate CPU Load
The source machine used a 12th-generation Intel Core i7-1255U with Iris Xe graphics. Jellyfin supports Intel Quick Sync and VA-API hardware acceleration on Linux when the container, device access, drivers, and Jellyfin settings are configured correctly.
how Jellyfin configures Intel Quick Sync and VA-API
However, the thread did not prove that missing GPU acceleration caused the original two-day load. Hardware acceleration mainly matters when Jellyfin is actually transcoding or performing compatible accelerated media processing.
One User Reported a Version-Specific Workaround
A community member said they had fewer startup problems by first configuring Jellyfin 10.10.7 and then upgrading to 10.11.6. That is personal experience, not an official Jellyfin or IceWhale recommendation.
Do not downgrade or pin Jellyfin solely because of that one reply. Check the current image version, release notes, and logs for your own installation.
A Better Troubleshooting Order
- Confirm whether the Jellyfin dashboard can load.
- Check which scheduled or library task is running continuously.
- Verify every media path is mounted and readable.
- Temporarily reduce expensive preview or chapter-image work if appropriate.
- Separate library-scan CPU load from active video transcoding.
- Verify hardware acceleration only if transcoding is part of the problem.
- Review Jellyfin application logs for repeating files or errors before reinstalling.
Jellyfin High CPU FAQ
Is 100% CPU normal during the first Jellyfin scan?
Short periods can happen, but this source thread did not treat two days of high CPU plus an unusable UI as normal.
Can thumbnails and chapter images increase CPU use?
Yes. Jellyfin documents extraction tasks for chapter images and key frames, and the community suggested disabling those temporarily as a diagnostic test.
Can a sleeping USB drive cause repeated scanning?
It can make media unavailable and trigger errors or repeated work. The thread raised storage availability as one possible cause, not as the confirmed cause.
Was the original problem solved?
No confirmed final resolution was posted in the thread.


